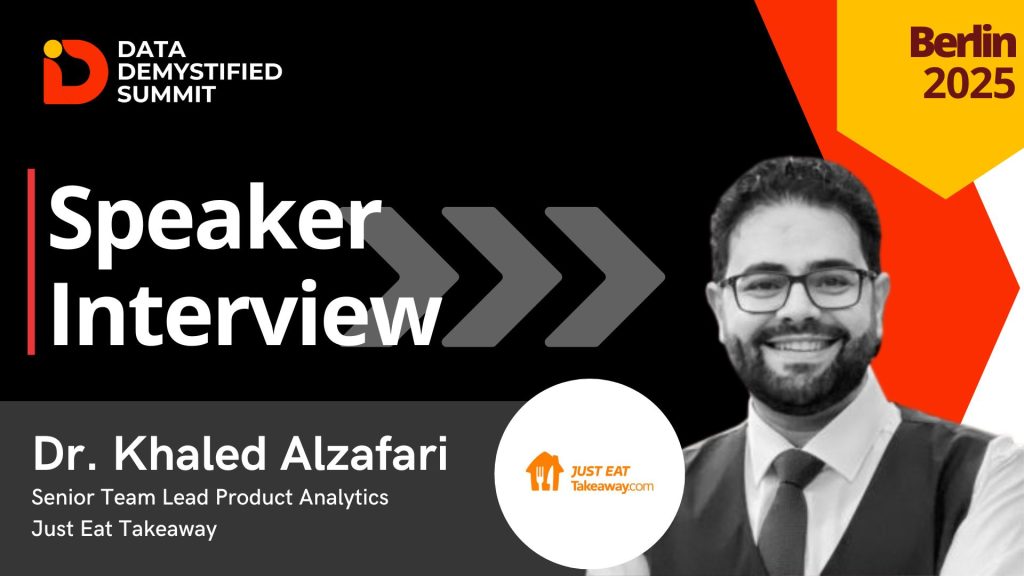
We are excited to feature Dr. Khaled Alzafari, Senior Team Lead Product Analytics at Just Eat Takeaway, in our Speaker Interview series. As a Data Demystified Summit Berlin speaker, Dr. Khaled Alzafari brings extensive expertise in data visualisation, analytics, and AI-driven decision-making. At the summit, he will be speaking in the Fireside Chat | [Data Visualisation] How to Turn Complex Customer Journey Data into Clear Insights, where he will share insights on balancing simplicity and detail in customer journey data, leveraging AI for more efficient data utilisation, and making data more engaging for non-technical stakeholders.
About Just Eat Takeaway
Just Eat Takeaway is a leading global online food delivery marketplace, connecting millions of customers with restaurants and grocery partners. Operating in multiple countries, the company leverages technology, data analytics, and AI to optimise food delivery services, enhance customer experiences, and support restaurant partners. By continuously innovating in logistics, automation, and customer insights, Just Eat Takeaway is shaping the future of food delivery with efficiency and convenience.
Quick Q&A with Dr. Khaled Alzafari
Could you please give us a quick introduction of yourself?
I’m Dr. Khaled Alzafari, the Senior Team Lead for Product Data Analytics at JusteatTakeaway. In my role, I leverage data-driven insights to inform strategic decision-making and spark innovation across our products. Beyond my work at JET, I’m passionate about nurturing the next generation of data professionals—I volunteer my time teaching crash courses on topics such as Research Methods, Advanced Statistics, Data Analytics, and Multivariate Analysis. I’ve also had the privilege of publishing several papers in peer-reviewed journals, which have enriched my perspective on the evolving landscape and raised the importance of the compatibility between qualitative and quantitative analysis.
Why did you choose to participate in this summit?
I believe in the power of community and the immense value that comes from supporting our data communities. Participating in this summit offers a fantastic opportunity to share insights, challenge our thinking, and learn from some of the brightest minds in the industry. It’s a perfect platform to exchange ideas and experiences that ultimately drive the field forward. For me, the conference isn’t just about presenting—it’s also about immersing myself in new perspectives that can further refine our practices and push the boundaries of what’s possible with data.
What tools or technologies do you recommend for simplifying complex data visualisation?
For me, it’s not just about the technology—it’s about telling the right story with data. Before diving into any visualisation tool, I ask myself: Who are my stakeholders, and what narrative do I need to convey? I challenge myself to consider the product and business impact by first defining the type of analysis required. For example, I often break it down into four key levels:
- Descriptive dashboards offer a high-level overview of customer interactions.
- Diagnostic views enable teams to explore the “why” behind the numbers.
- Predictive models help forecast future trends.
- Prescriptive insights recommend actions or decisions to optimise outcomes based on predicted future scenarios.
By understanding whether I’m addressing an engineering team, a product owner, or executive leadership, I tailor the visualisation to fit their specific needs. Once the story is clear, I select tools that best serve that narrative. Interactive platforms like Tableau or Power BI can be invaluable for creating dynamic, user-friendly dashboards, while more customisable solutions like Python offer the flexibility to fine-tune visuals to perfectly match the story I want to tell.
In essence, technology is a powerful enabler, but it’s the human touch—knowing your audience and crafting a compelling story—that transforms raw data into insights that drive real business impact. I remind myself and my fellow analysts that “Keep in mind that the goal is to transform raw data into clear, compelling narratives that can be understood by diverse stakeholders. This will empower us to make well-informed decisions based on comprehensive data-driven insights”.
Any good example of visualisation techniques that help teams make faster, data-driven decisions?
One approach I take is to start by mapping out the entire customer journey with a comprehensive overview. I often begin by stacking large amounts of data using techniques like a Sankey diagram or flow analysis. This initial step allows me to understand the full story—capturing every touchpoint and transition.
Once I have that holistic view, I move on to crafting a clear narrative with simpler, more focused charts. Depending on the level of granularity I want to convey, I might use gauge charts to showcase performance against targets, multi-axis line charts for trends over time, or even sunburst charts to illustrate hierarchical relationships within the data. This layered approach ensures that my message is tailored to different audiences, from high-level executives to detail-oriented analysts.
After delivering the core insights, I unveil my dashboard as a self-service tool. This interactive platform enables our audience to deep dive into the details and slice and dice the data as needed. To ensure clarity, I define the key performance indicators directly on the dashboard while providing a glossary page that explains the underlying calculations. This method not only speeds up decision-making but also empowers teams to explore the data in a way that’s both intuitive and impactful.
What upcoming developments in your industry are you most eager to explore?
At JusteatTakeaway, we’re embarking on an exciting journey as we rapidly integrate AI into our operations. Our primary focus is to leverage AI to enhance support for our customers and consumers—ensuring customers make the best choices when ordering, providing timely assistance to our partners, and delivering efficient CS support via our chatbots. Although this foray into AI is still in its early stages, the potential is vast.
From a personal perspective, I’m excited to see how AI will not only revolutionise the food and convenience delivery sector but also transform our data analysis practices. As we delve deeper into AI, our goal is to optimise and streamline our operations while gaining a deeper understanding of customer behaviors and preferences. This will enable us to provide a more personalised and efficient service, ultimately enhancing customer satisfaction and loyalty.
Additionally, AI has the potential to improve our operational efficiency significantly. By automating routine tasks and analysing vast amounts of data, AI can help us identify areas for improvement, optimise delivery, and predict demand, leading to better customer and partner journeys and faster delivery times. Furthermore, AI can play a crucial role in issue prevention/prediction, ensuring an efficient platform for our customers and partners.
Join Dr. Khaled Alzafari and other industry leaders at the Data Demystified Summit Berlin to gain actionable insights. His session will provide valuable perspectives on simplifying complex customer journey data and fostering data-driven decision-making. Don’t miss the opportunity to learn from his expertise!
Join Us Now!
We are looking forward to meeting you In Berlin on 4 March 2025!
➡ Get tickets now! https://datademystifiedsummit.com/berlin-registration/
➡ Interested in becoming a partner? Don’t hesitate to get in touch with us at Hello@datademystifiedsummit.com .
Stay up to date with our Speaker Line-up, Session Information, and Agenda Updates by following us on: